
Global supply chains have been facing several major disruptions in 2021 and port congestion is only one of them. Vessel schedule disruptions with increases of up to 45% in the ratio of container rollovers, increased transit times, and increases in blank sailings are among the underlying factors causing shipment delays and global supply chain disruptions.
These metrics have been tracked and analyzed by project44, the world’s leading container visibility platform, explained Josh Brazil, VP of Data Insights at project44.
“While the current supply chain disruptions have been widely attributed to port congestion, we have
been tracking a few other correlated metrics that contribute to this unprecedented global crisis. Looking at future blank sailing schedules there seems to be no immediate improvement on the horizon and we don’t see the situation improving until after Lunar New Year in 2022 when China will shut down for about two weeks. At the same time, also bear in mind that about 60-70,000 containers are expected to come into service around mid-2022 and many of the new vessel orders will be on the water by mid-late 2023.”
Container Rollovers
Global container movement has been affected significantly by an increasing number of containers rolled and delayed across major transhipment hubs around the world, said Brazil:
“Ports were never meant to be storage facilities and in most cases average dwell time for transhipment containers used to be 5 days maximum.”
A three-year data map analysed by project44 of transhipment containers only shows the ratio of container rollovers at major ports between 2019 and 2021.
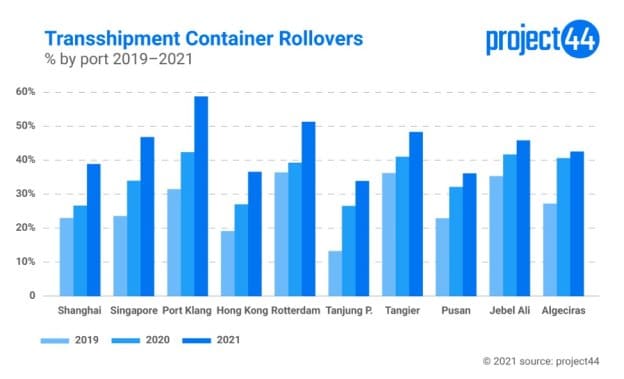
Out of the major transhipment ports considered in the analysis,
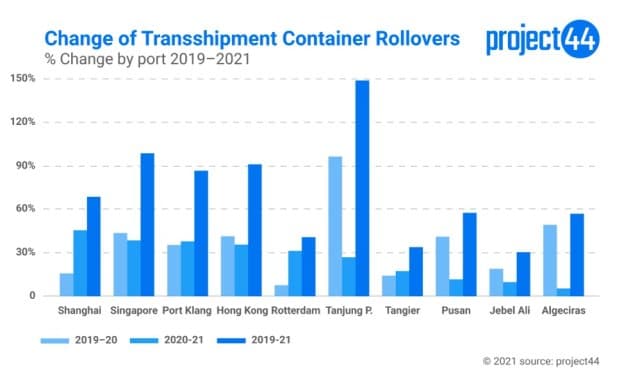
- Port Klang had the highest rollover percentage 58.45% in 2021 which is an increase of 37.94% compared to 2020.
- Shanghai recorded 38.66% of rollovers in 2021 which is an increase of 45.22% compared to the rollovers in 2020.
- Algeciras, Jebel Ali, Pusan, Tanjung Pelepas, Hong Kong and Singapore all recorded higher percentage of rollovers in 2021 compared to 2020 but the percentage of change was lower than 2019-2020.
- On the European side, Rotterdam showed an increase with rollovers increasing from 38.95% in 2020 to 51.00% in 2021 which is an increase of 30.94% compared to the 7.42% change in 2019-2020.
For Josh Brazil,
“The increase in rollovers at key transhipment ports around the world is a worrying factor in terms of schedule reliability. This means continuing schedule uncertainty, consistent increases and delays in cargo lead times.”
Disclaimer: The rollover percentages are based on the percentage of containers that were loaded on a vessel other than the initially planned vessel. Rollovers can happen due to a variety of reasons and these numbers are not necessarily correlated with the quality of operations by the carrier or the port concerned.
Transit Times
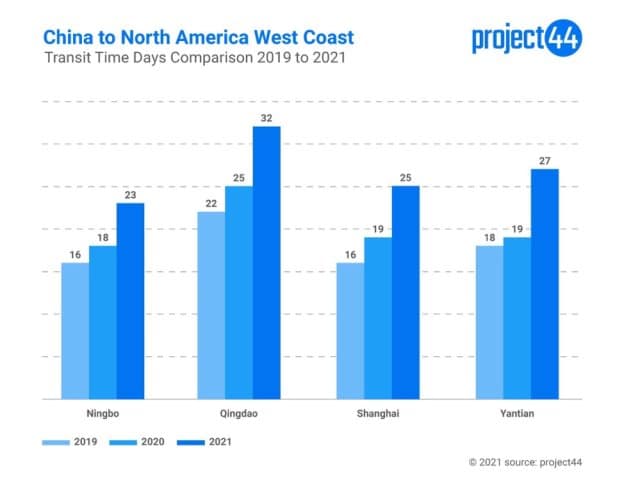
According to project44 data, transit time for containers has also drastically increased between 2019 and 2021 for the main corridors of China to North America West Coast and China to Europe. Transit time in this analysis refers to the time it takes for a container loaded on a ship at a Port of Load (PoL) to reach the Port of Discharge (PoD).
When comparing the main ports in China to the West Coast of North America, Yantian had the highest percentage change in transit time increasing by 42.11% in 2021 compared to its 2020 levels while Ningbo had the lowest percentage increase at 27.78%.
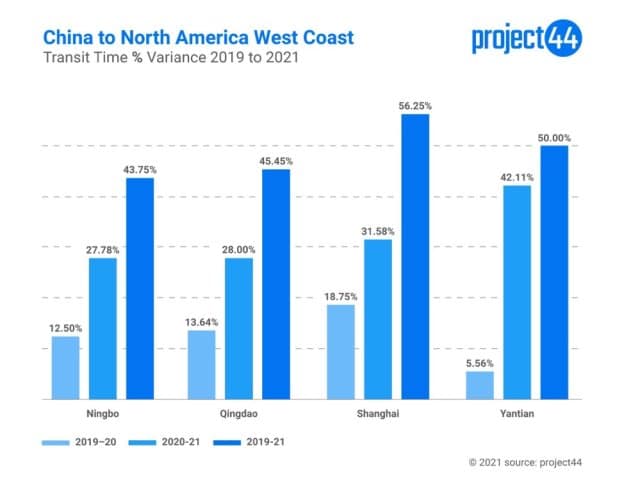
When compared to 2019 levels, the 2021 transit time increases were all above 40% which is significant considering the already stressed supply chains. On the service to Europe, Shanghai had the highest percentage increase in transit time increasing by 30.56% in 2021 compared to its 2020 levels while Qingdao had the lowest percentage increase at 25%.
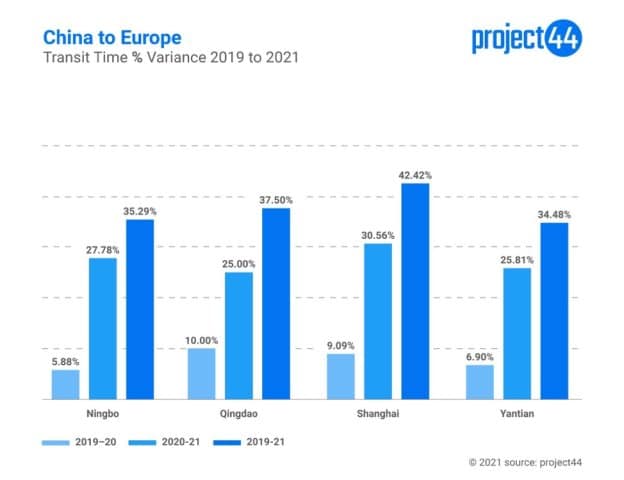
When compared to 2019 levels, the 2021 transit time increases were all above 35% which is significant as this is a major contributor to the shipment delays to the point that consumers are not getting what they want, when they want it.
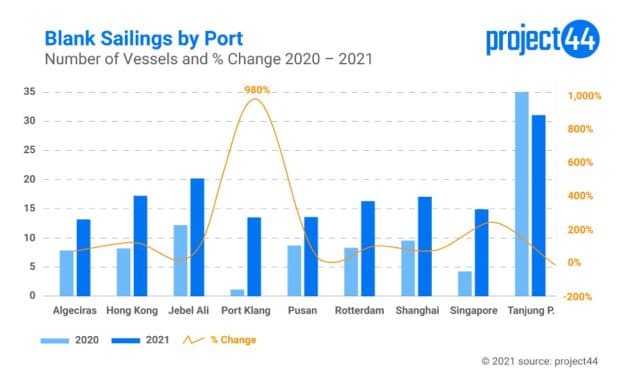
Blank Sailings
Blank sailing is another major factor that impacts container rollovers and as per Josh Brazil:
“Blank sailings is a key factor in network disruption. The number of containers sitting in tranship ports on “sweeper” vessels has distorted the equilibrium in the global network.”
Blank sailing in this analysis is when a ship that is scheduled to call a specified port skips that port. Data curated by project44 shows an increase in the number of vessels that skipped their scheduled port calls leaving hundreds of thousands of containers and millions of shipments behind putting further pressure not only on consumers but on container terminals and personnel.
Tanjung Pelepas in Malaysia recorded the highest number of blank sailings in 2021 with 31 blank sailings which was a slight improvement to the 35 blank sailings in 2020. It is still on the higher side working out to an average of around three ships skipping the port per month.
The largest increase in the number of blank sailings was, however, Port Klang which recorded 13.5 blank sailings in 2021 compared to 1.25 blank sailings on average in 2020 across the same services. This is a staggering 980% increase compared to 2020.
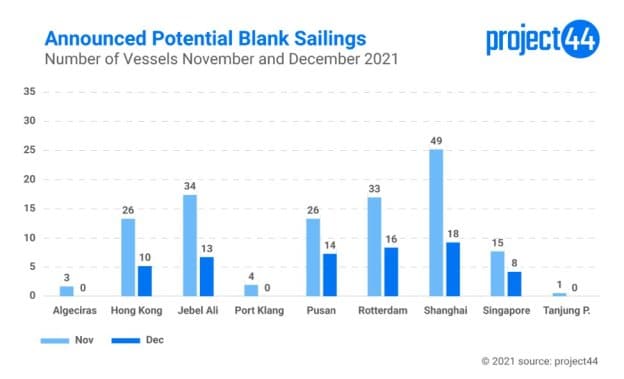
As per project44’s analysis of the carrier’s sailing schedules, the trend of blank sailings seems to be continuing well into November and December 2021 with up to almost 50 blank sailings on some routes.
For Brazil,
“Blank sailings have been of a bigger consequence for feeder services, smaller ports, and markets inherently hard to service such as Iraq, Indonesia outports. Export markets in the USA and Europe have been crippled due to these blank sailings as carriers are missing opportunities to reposition empty containers back to Asia where they are much in demand. We have seen that carriers are, however, looking for service opportunities where they could possibly get 2-3 extra vessels on the East-West trade for empty repositioning as it would be better for them to move empties than utilising them for exports as a lot of these exports are for low price commodities which tie up the equipment.”
Disclaimer: The data referenced in this release is sourced from project44’s freight visibility platform, based on
the logistics indicators that the platform tracks. The sample data sets referenced do not include all
freight movement data tracked by other entities. Data from project44’s platform reflects a statically
significant sample size to draw conclusions.